a plug-in for vowels.R

durplot3d
|
durplot3d is a simple function for R which can be used to generate three dimensional vowel plots of acoustic formant and duration data. See the example figure and information below. It was used by Valerie Fridland and Tyler Kendall (mostly for exploratory data analysis) in their paper presented at NWAV 38. Reference: Fridland, Valerie and Tyler Kendall. 2009. Mapping production and perception in regional vowel shifts: The effects of vowel duration and formant trajectories. Paper presented at NWAV 38. University of Ottawa.
|
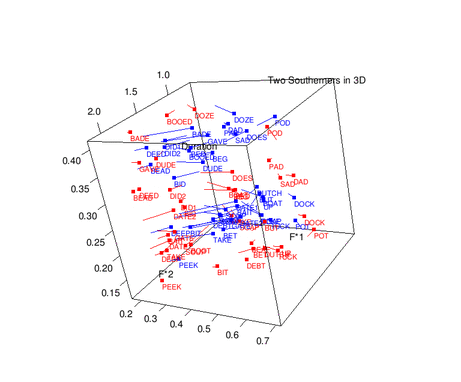
The durplot3d function is a plug-in for the vowels.R package in R (see CRAN: vowels.R, NORM, R Project). It generates three dimensional interactive plots of vowels (with glides) in F1 x F2 x duration space. These can be spun about and zoomed into, as illustrated in the figure below (mouse-over for animation). You can also take screen captures using the rgl.snapshot() function in the RGL library.
To use the durplot3d function, you need to have the vowels.R library installed in your local R environment as well as the RGL library (see CRAN: RGL). Download and run the following file in R to load the function in R's memory. Alternatively, you can "source" the file directly from this website by executing the following command in R: source('http://lingtools.uoregon.edu/tools/durplot3d/files/durplot3d.R'). (However, please note that you still must have vowels.R and RGL installed in your R environment.)
| Download: & sampledata.txt [ 5 kb; Last Mod: 2/15/2019 ] |
The durplot3d function takes as its input data very similar to that used by the vowels.R package and the NORM web-based software (see the How to use NORM webpage). However, the context column should be used to store your vowel duration measurements (truth be told: the context column in the NORM input files is just there as a reference to users - NORM does not use that column's information and anything can be stored there, including duration measurements). Slightly modifying from the How to use NORM webpage: Your data must be in tab-delimited text files. The files should start with one row that contains header labels (e.g., "speaker","vowel", "duration", "F1", "F2", ...). The specific text of the header row is entirely up to you, provided that the columns are in the following order:
| Speaker Name | Vowel | Duration | F1 (onset or nucleus) | F2 (onset or nucleus) | F3 (onset or nucleus) | F1 (glide, if any) | F2 (glide, if any) | F3 (glide, if any) |
Each row in your file should contain the data for one vowel instance. Note that you can leave the F3 columns blank, but you must include the columns.
You can manipulate your data using the normal vowels.R functions. For example, the figure on the right was generated from the sample data above using the following code (download the sample data and run this yourself!):
 |
| Fig. 1: Sample 3D durplot [ animate/popup larger image ] |
# this automatically loads the vowels.R and RGL libraries
source('http://lingtools.uoregon.edu/tools/durplot3d/files/durplot3d.R')
vowels<-load.vowels() # Select the data file in the pop-up
nvowels<-norm.nearey(vowels, use.f3=TRUE) # normalize (see note below)
# plot the data using the durplot3d() function
# note this takes many of the same parameters as the vowels.R vowelplot() function
durplot3d(nvowels, color="speakers", labels="vowels", title="Two Southerners in 3D", subtitle="")
rgl.snapshot(file.choose(new=T)) # take a "snapshot" and store it as a png file
Note 1: The above code sample normalized the vowel data using Nearey's method of vowel normalization (see Nearey in NORM's methods). Normalization is necessary here to make the female and male speakers' vowel spaces in the sample data more comparable. The current version of the durplot3d() function requires that the input data have columns for F3 (regardless of whether there are data for F3). However, many of the vowels.R normalization methods do not result in data frames with columns for F3. If you normalize your data, you'll either want to ensure that you use a method that does maintain F3 columns or you'll need to manually manipulate your data frames to have a format matching the above description.
Note 2: The compute.means() function in vowels.R replaces the content in the third column (typically the context column) with the number of vowels meaned for each vowel class/speaker. This, Tyler believes, makes sense for the vowels.R package's normal functions, but unfortunately means that it automatically deletes - instead of averages - the duration data, when the duration data are stored in that column. A future version of the durplot3d() function will need to account for this, but for present purposes please be aware that this means you cannot use the vowels.R compute.means() function and then plot your meaned data using durplot3d(). The best solution to this right now is either to manually compute your mean formant and duration data in Excel or R - that is, manually create the data frame that you feed into the durplot3d() function - or copy the duration column to its own vector in R, generate the means for that as needed and then replace the third column with that new meaned duration vector after using the compute.means() function on the data frame.
last mod: 2/15/2019