Figures
We re-present many of the figures here, so readers can access full color versions of a few of the figures. For several of the figures we provide R code and source data, for reproducing the figures or examining their data more closely.
See the Audio page for the audio and Praat TextGrid files used for many of the screenshots created for the book.
You may need to right-click links to files to download or save the files to your computer.
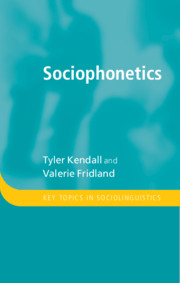
Figure 2.3 Word list productions of phase [fez] and Steve [stiv] by a young male European American from North Carolina.
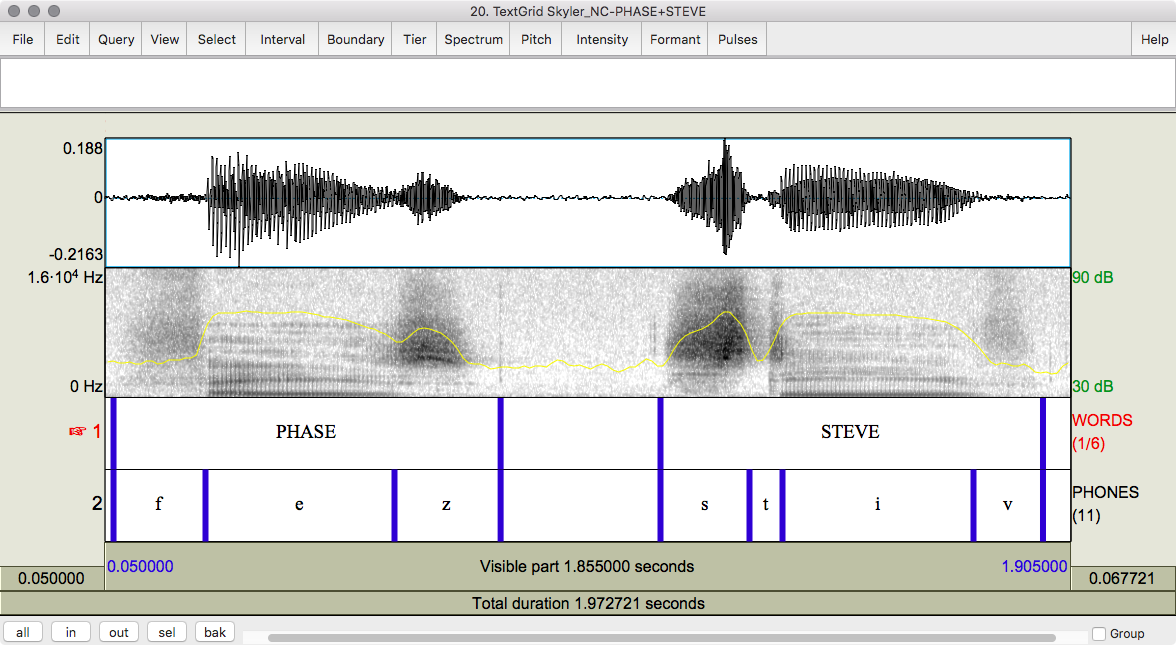
Figure 3.1 Word list productions of bed [bɛd], bait [bet] and pail [pel] by an older female European American from Tennessee.
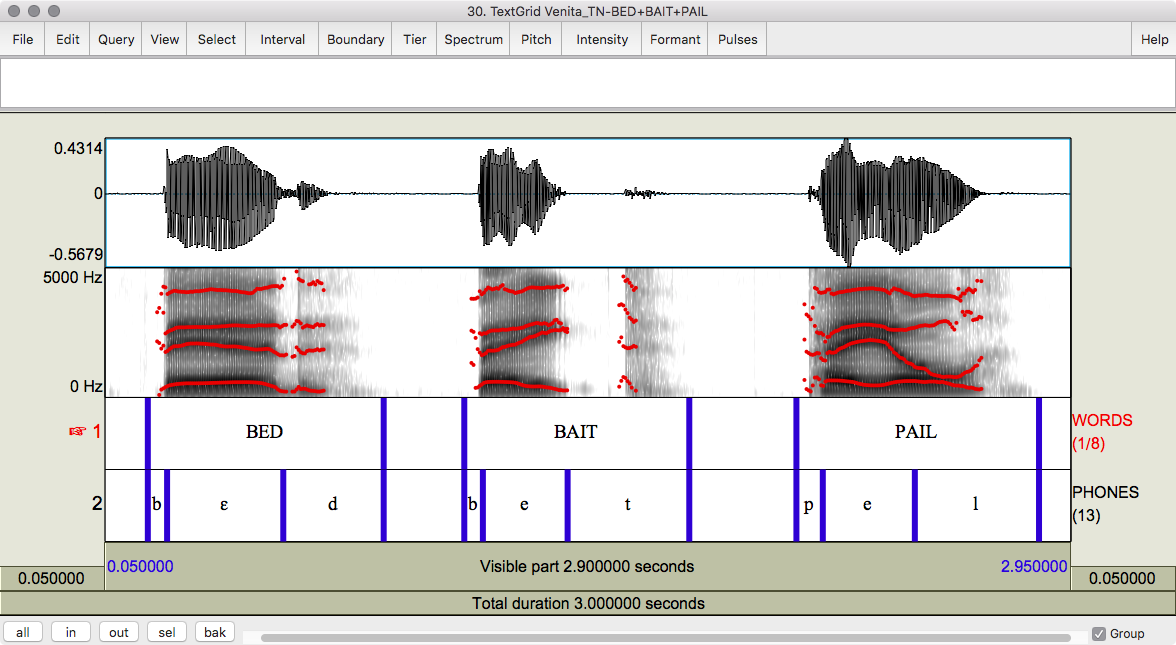
Figure 3.2 Two speakers exemplifying conventions for vowel plotting.
Data used for this figure: Fig3_2_data-KristenNY+LindseyNV.txt
Script to reproduce this figure: Create_Fig3_2_Dec2020.R
Figure 3.3 Three different styles of vowel plots displaying vowel data for a young European American female from Tennessee.
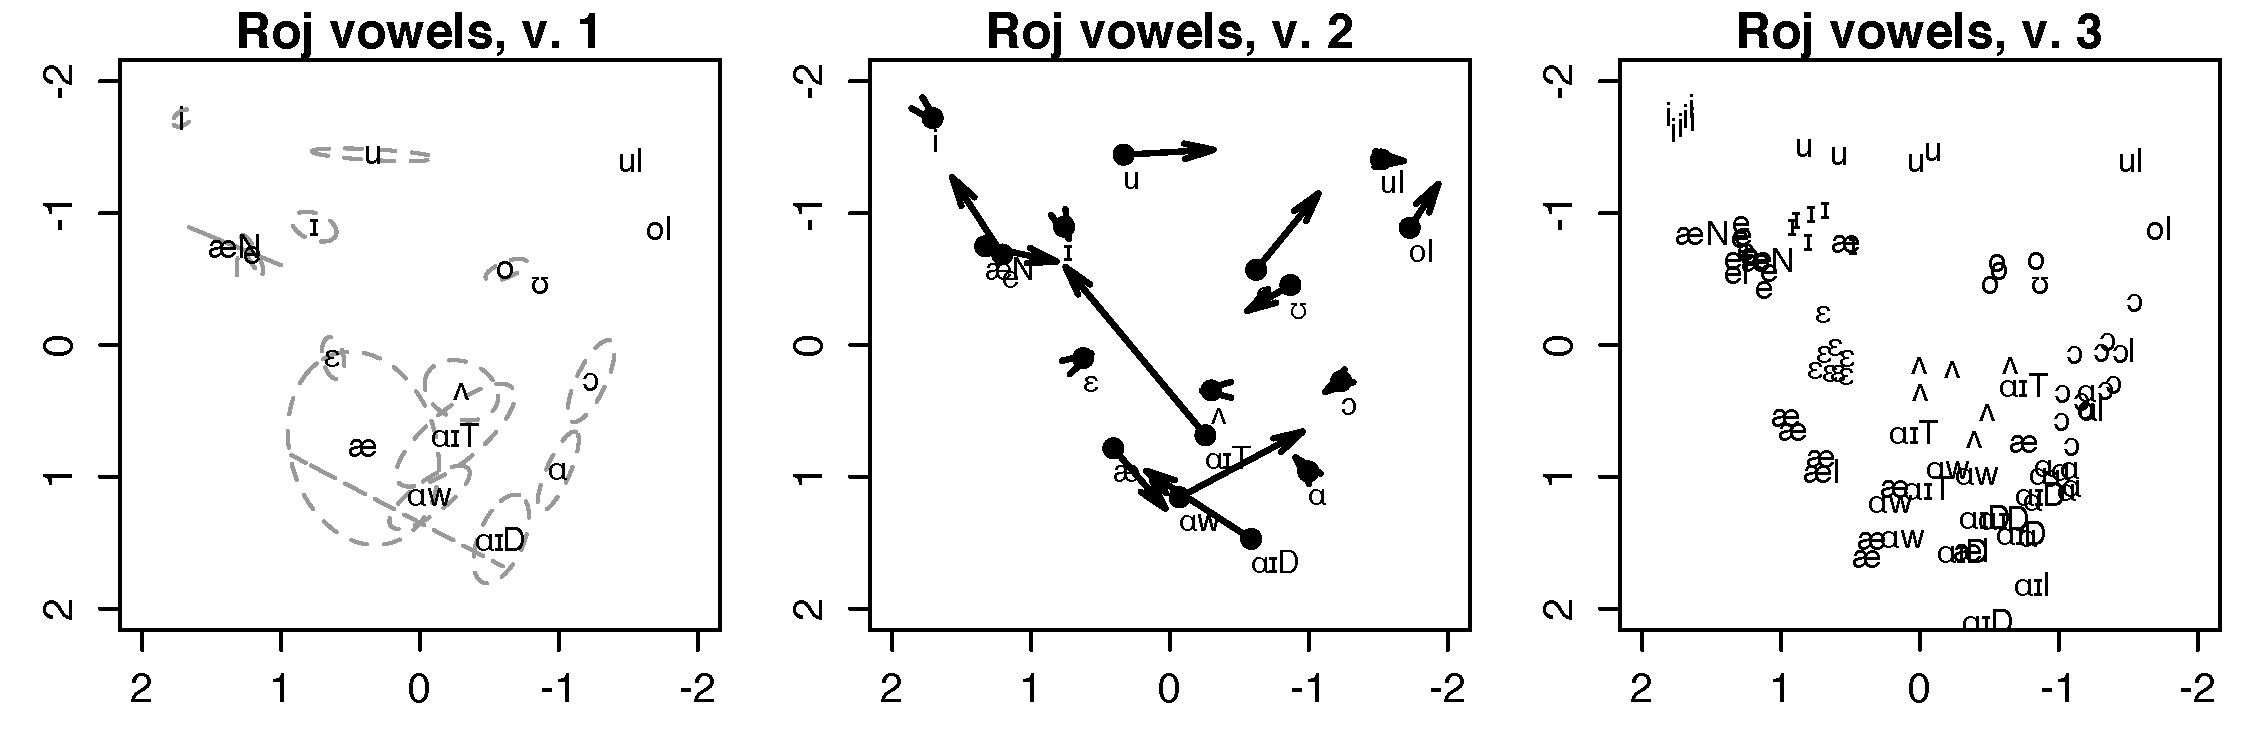
Data used for this figure: Fig3_3_data-RojTN.txt
Script to reproduce this figure: Create_Fig3_3_Dec2020.R
Figure 3.4 A female and a male speaker’s vowel plots (unnormalized data).
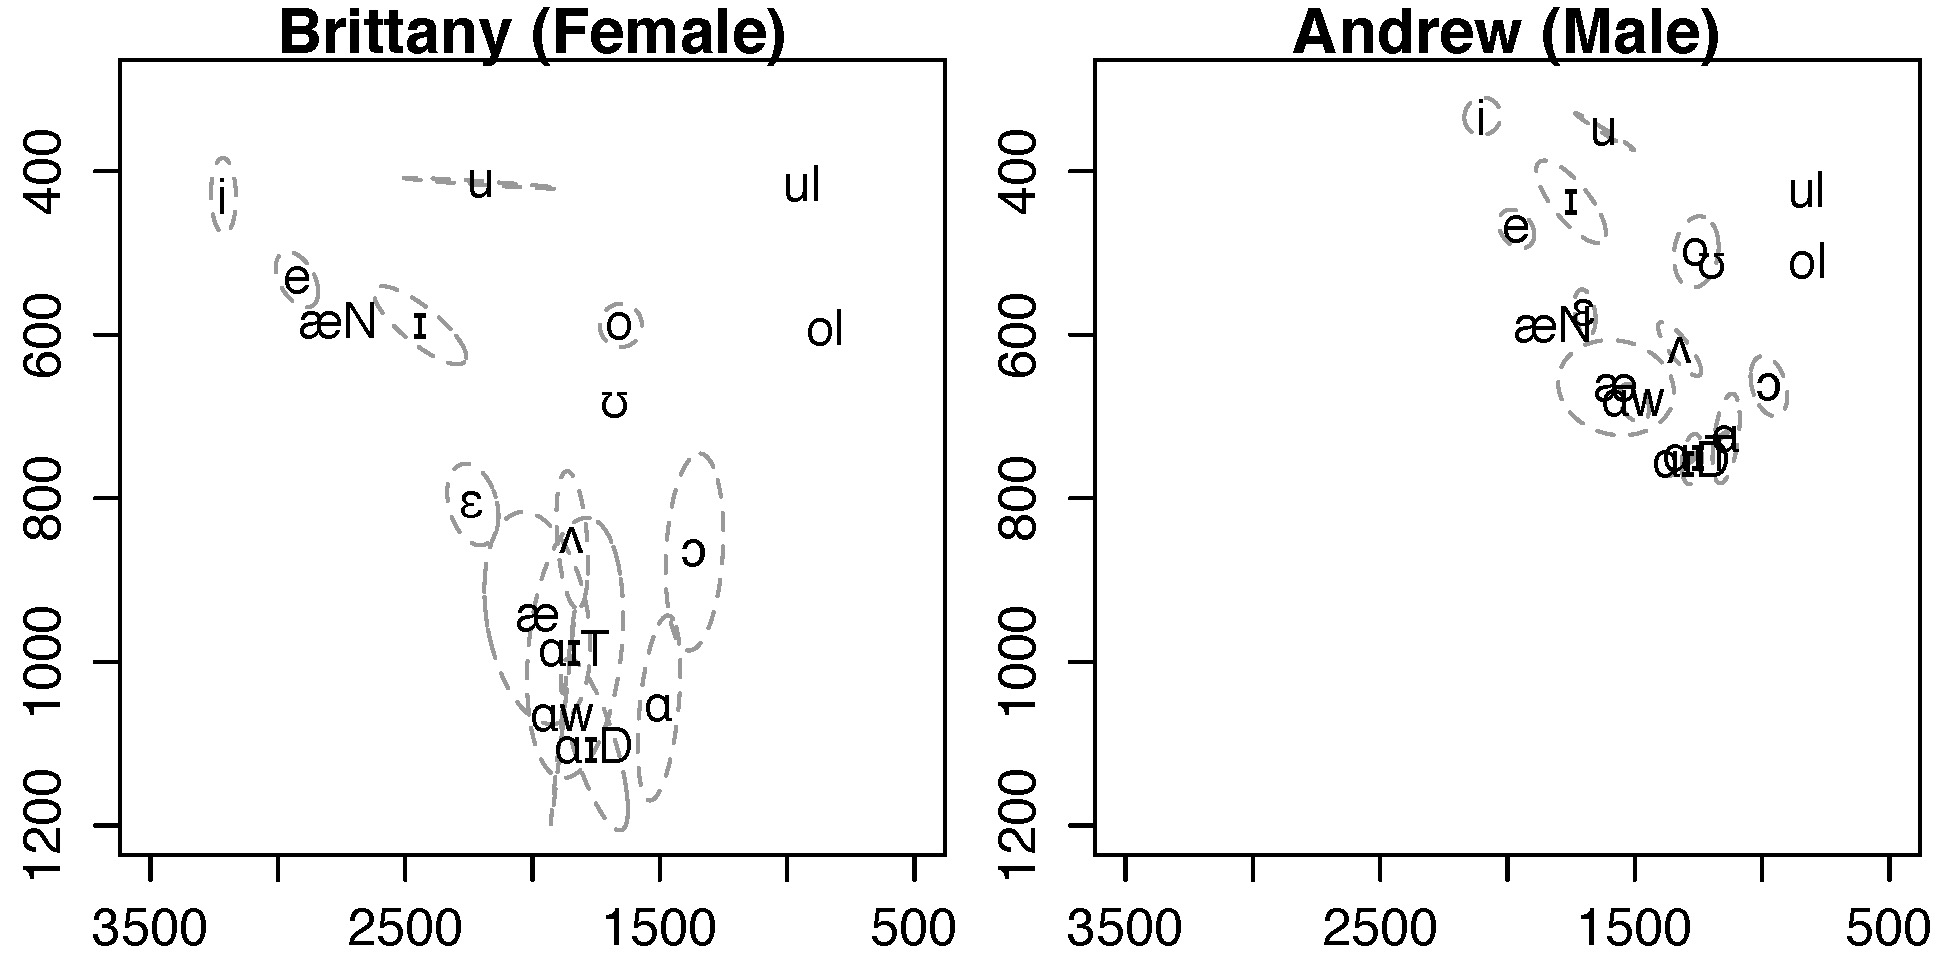
Data used for this figure: Fig3.4-5-data_Brittany+Andrew.txt
Script to reproduce this figure: Create_Figs3_4-5_Dec2020.R
Figure 3.5 The same female and male speakers shown in Figure 3.4 after normalization (using the Lobanov method).
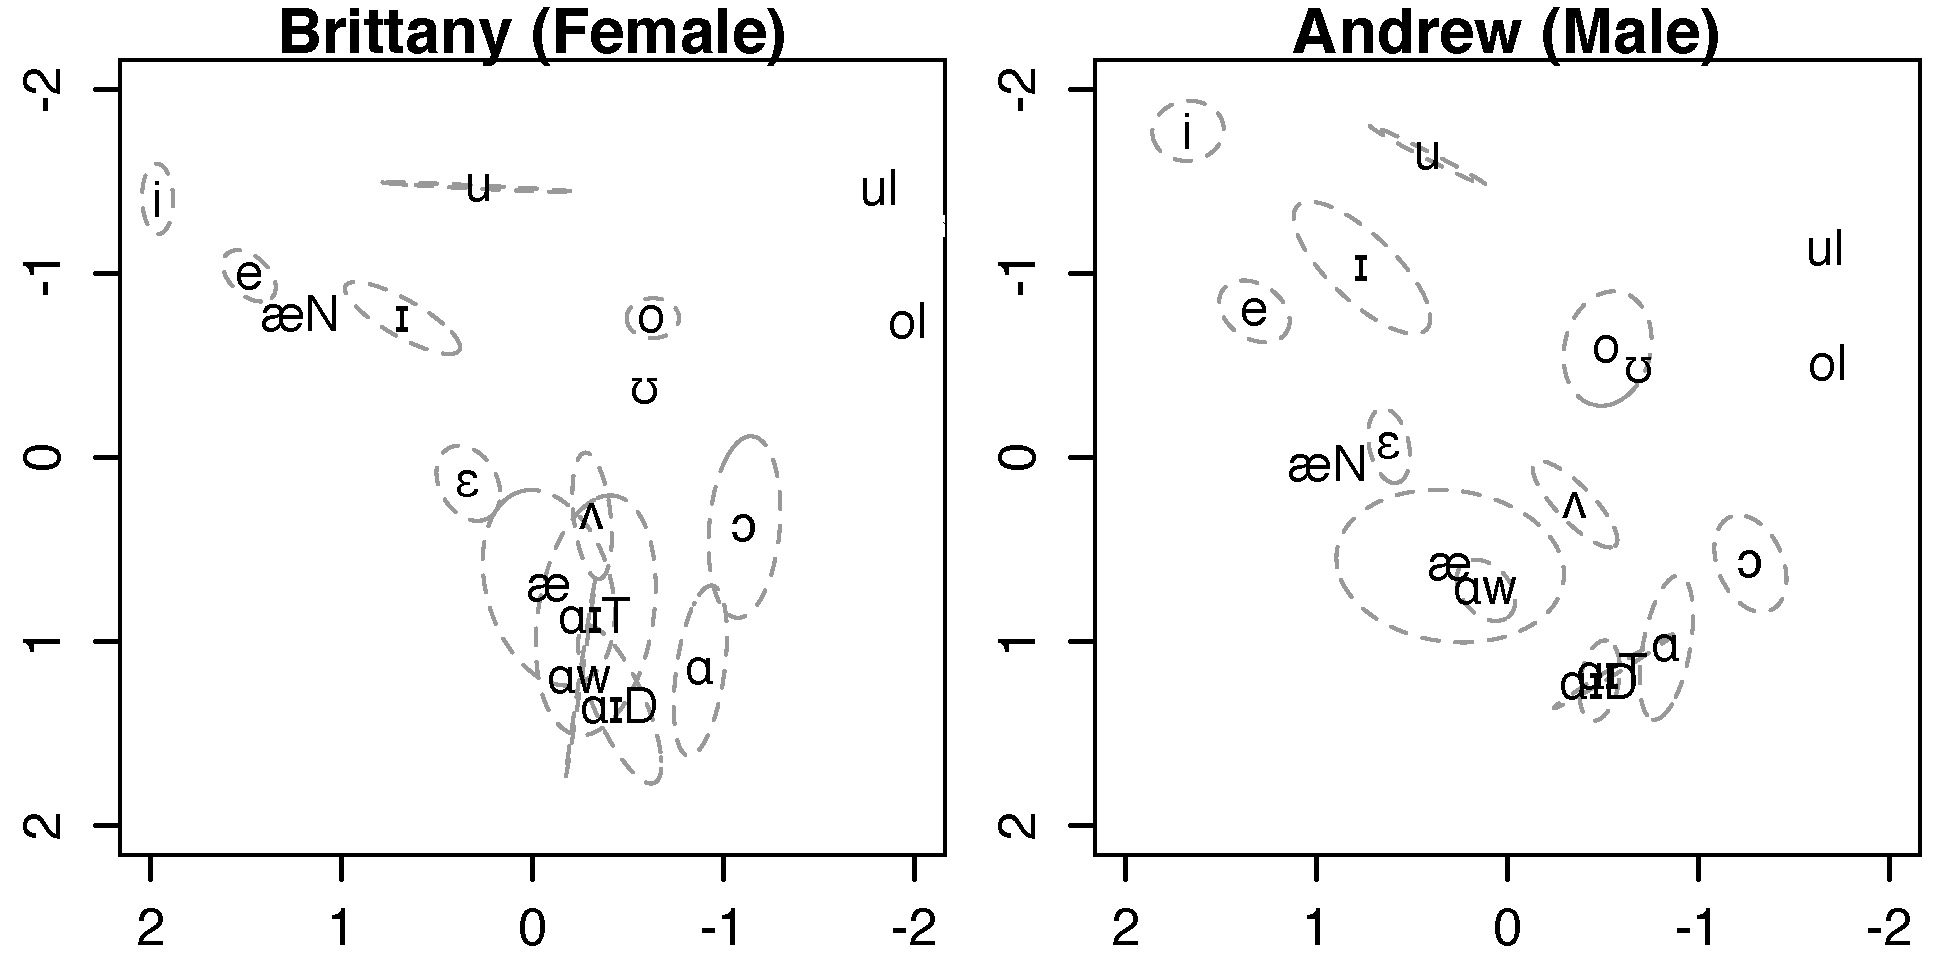
Data used for this figure: Fig3.4-5-data_Brittany+Andrew.txt
Script to reproduce this figure: Create_Figs3_4-5_Dec2020.R
Figure 3.6 Productions of phase [fez] and face [fes] by a young female European American from Oregon.
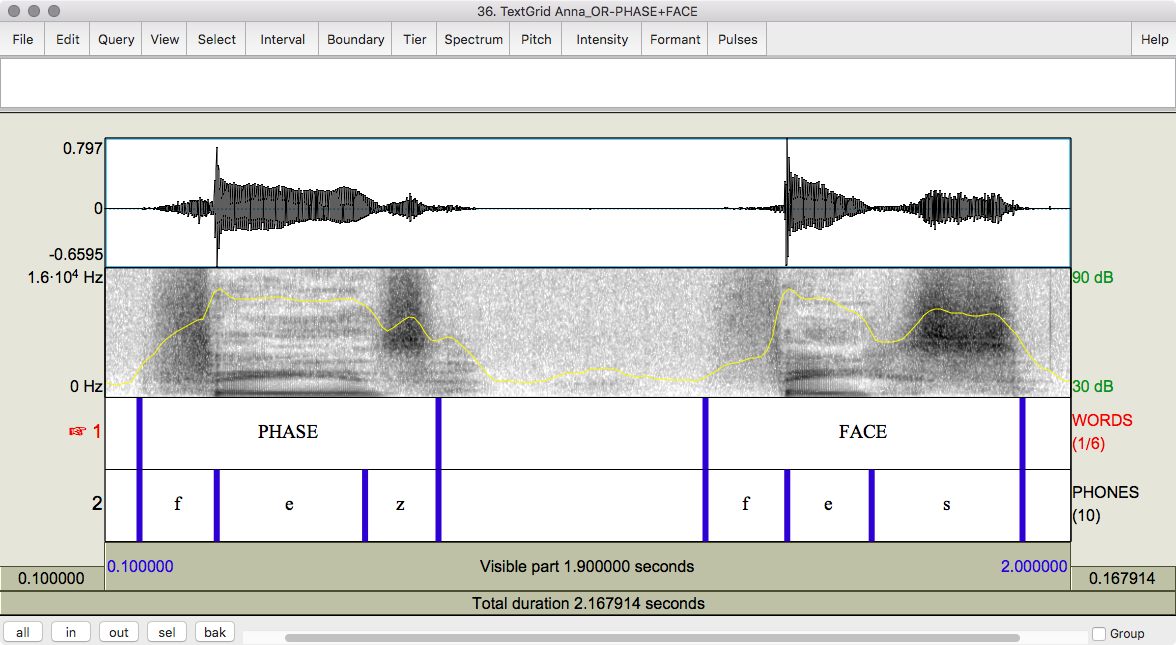
Figure 4.5 Map of perception-based dialect clusters from Kendall and Fridland (2016).
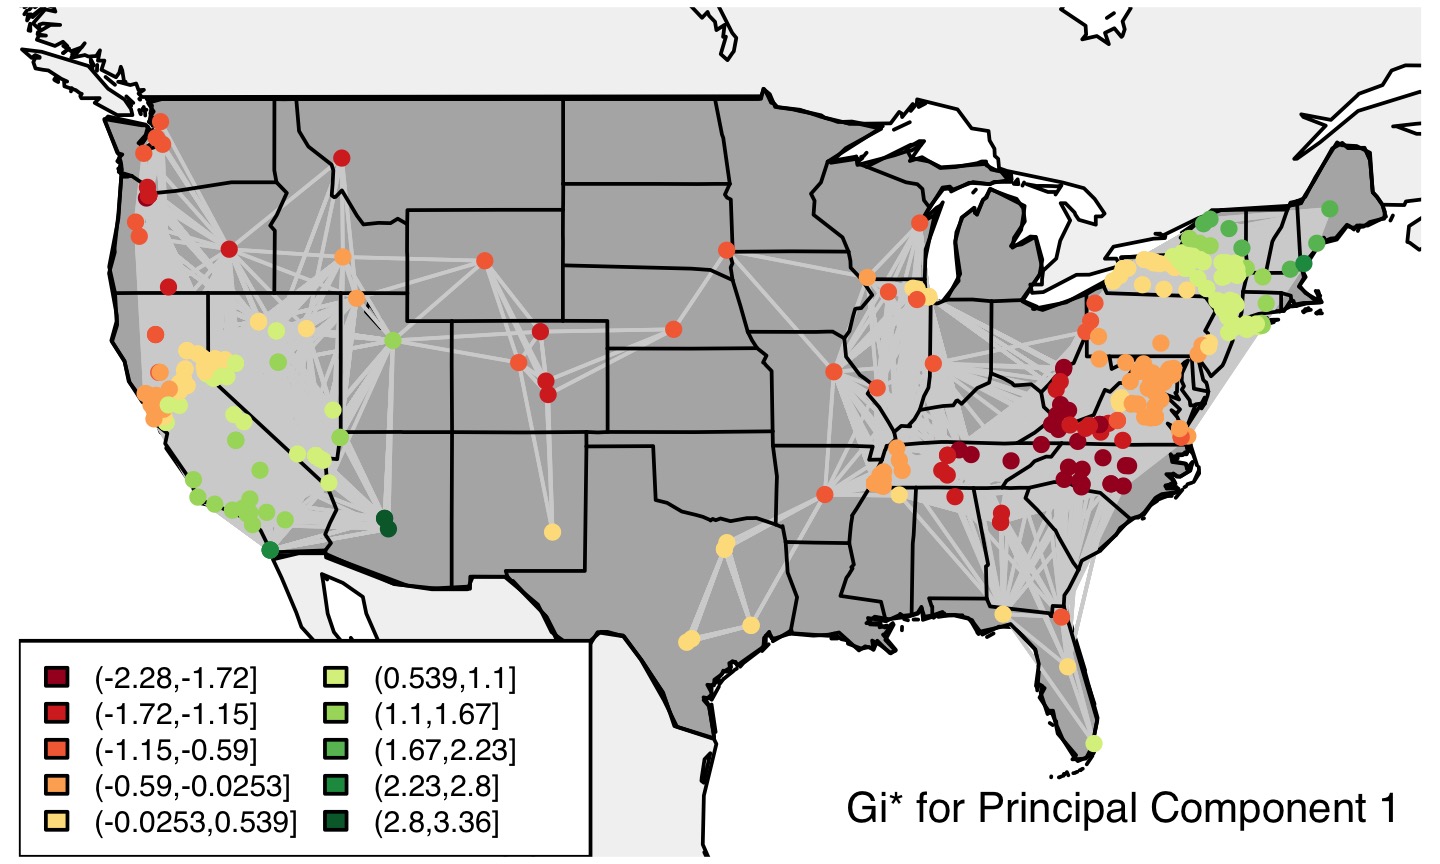
Figure 5.1 Peterson and Barney's vowel data.
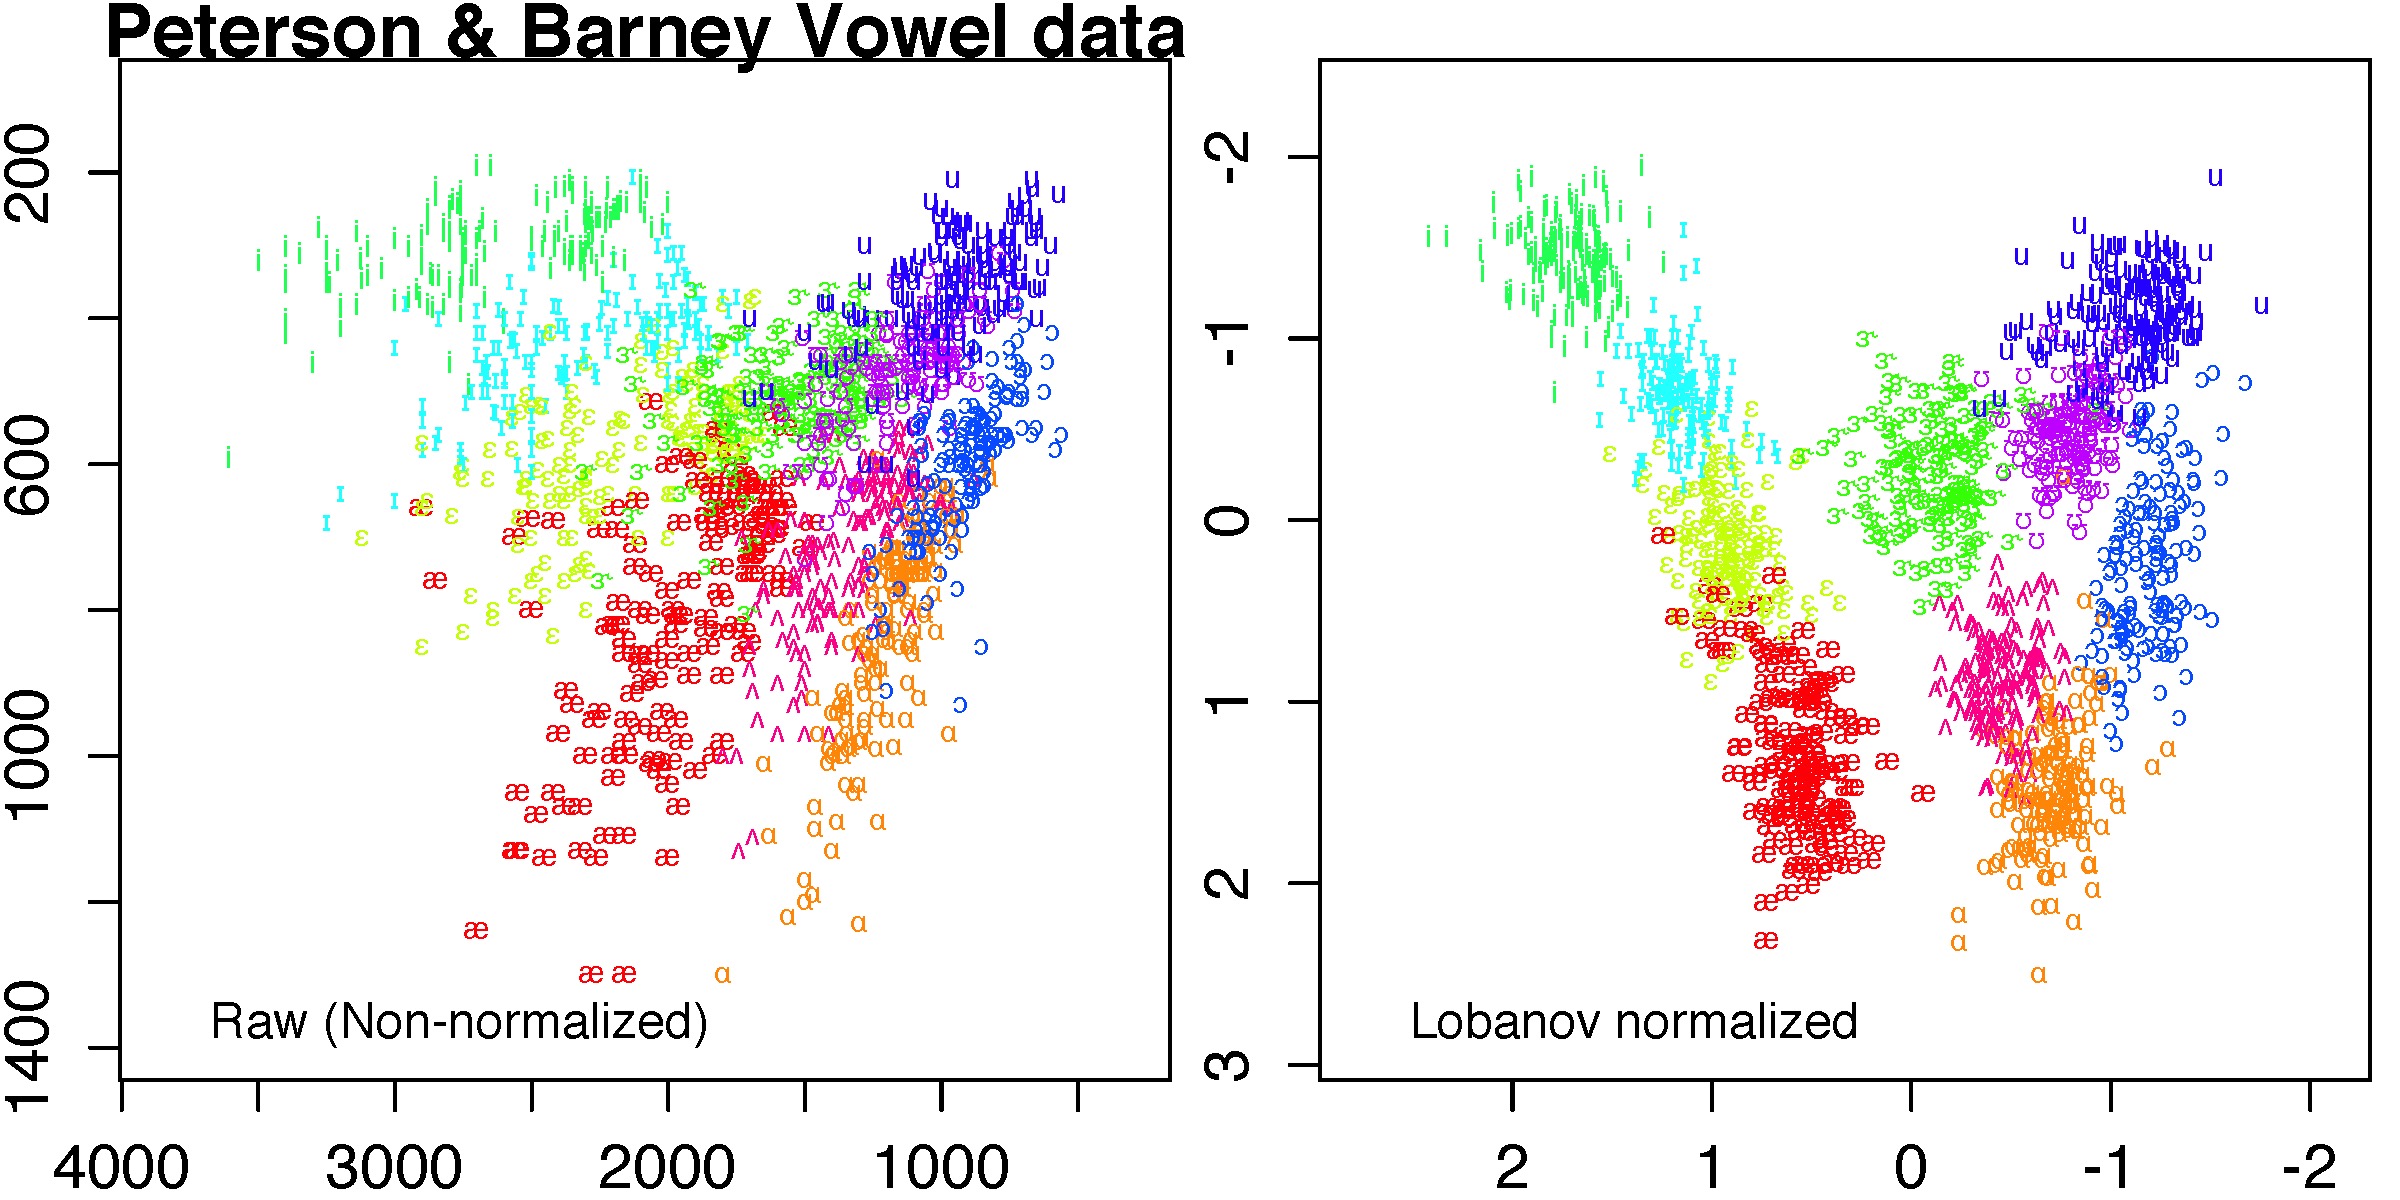
Data used for this figure: pb1952.csv
Script to reproduce this figure: Create_Fig5_1_Dec2020.R
Figure 6.1 CORAAL speaker DCB_se3_ag3_f_01.
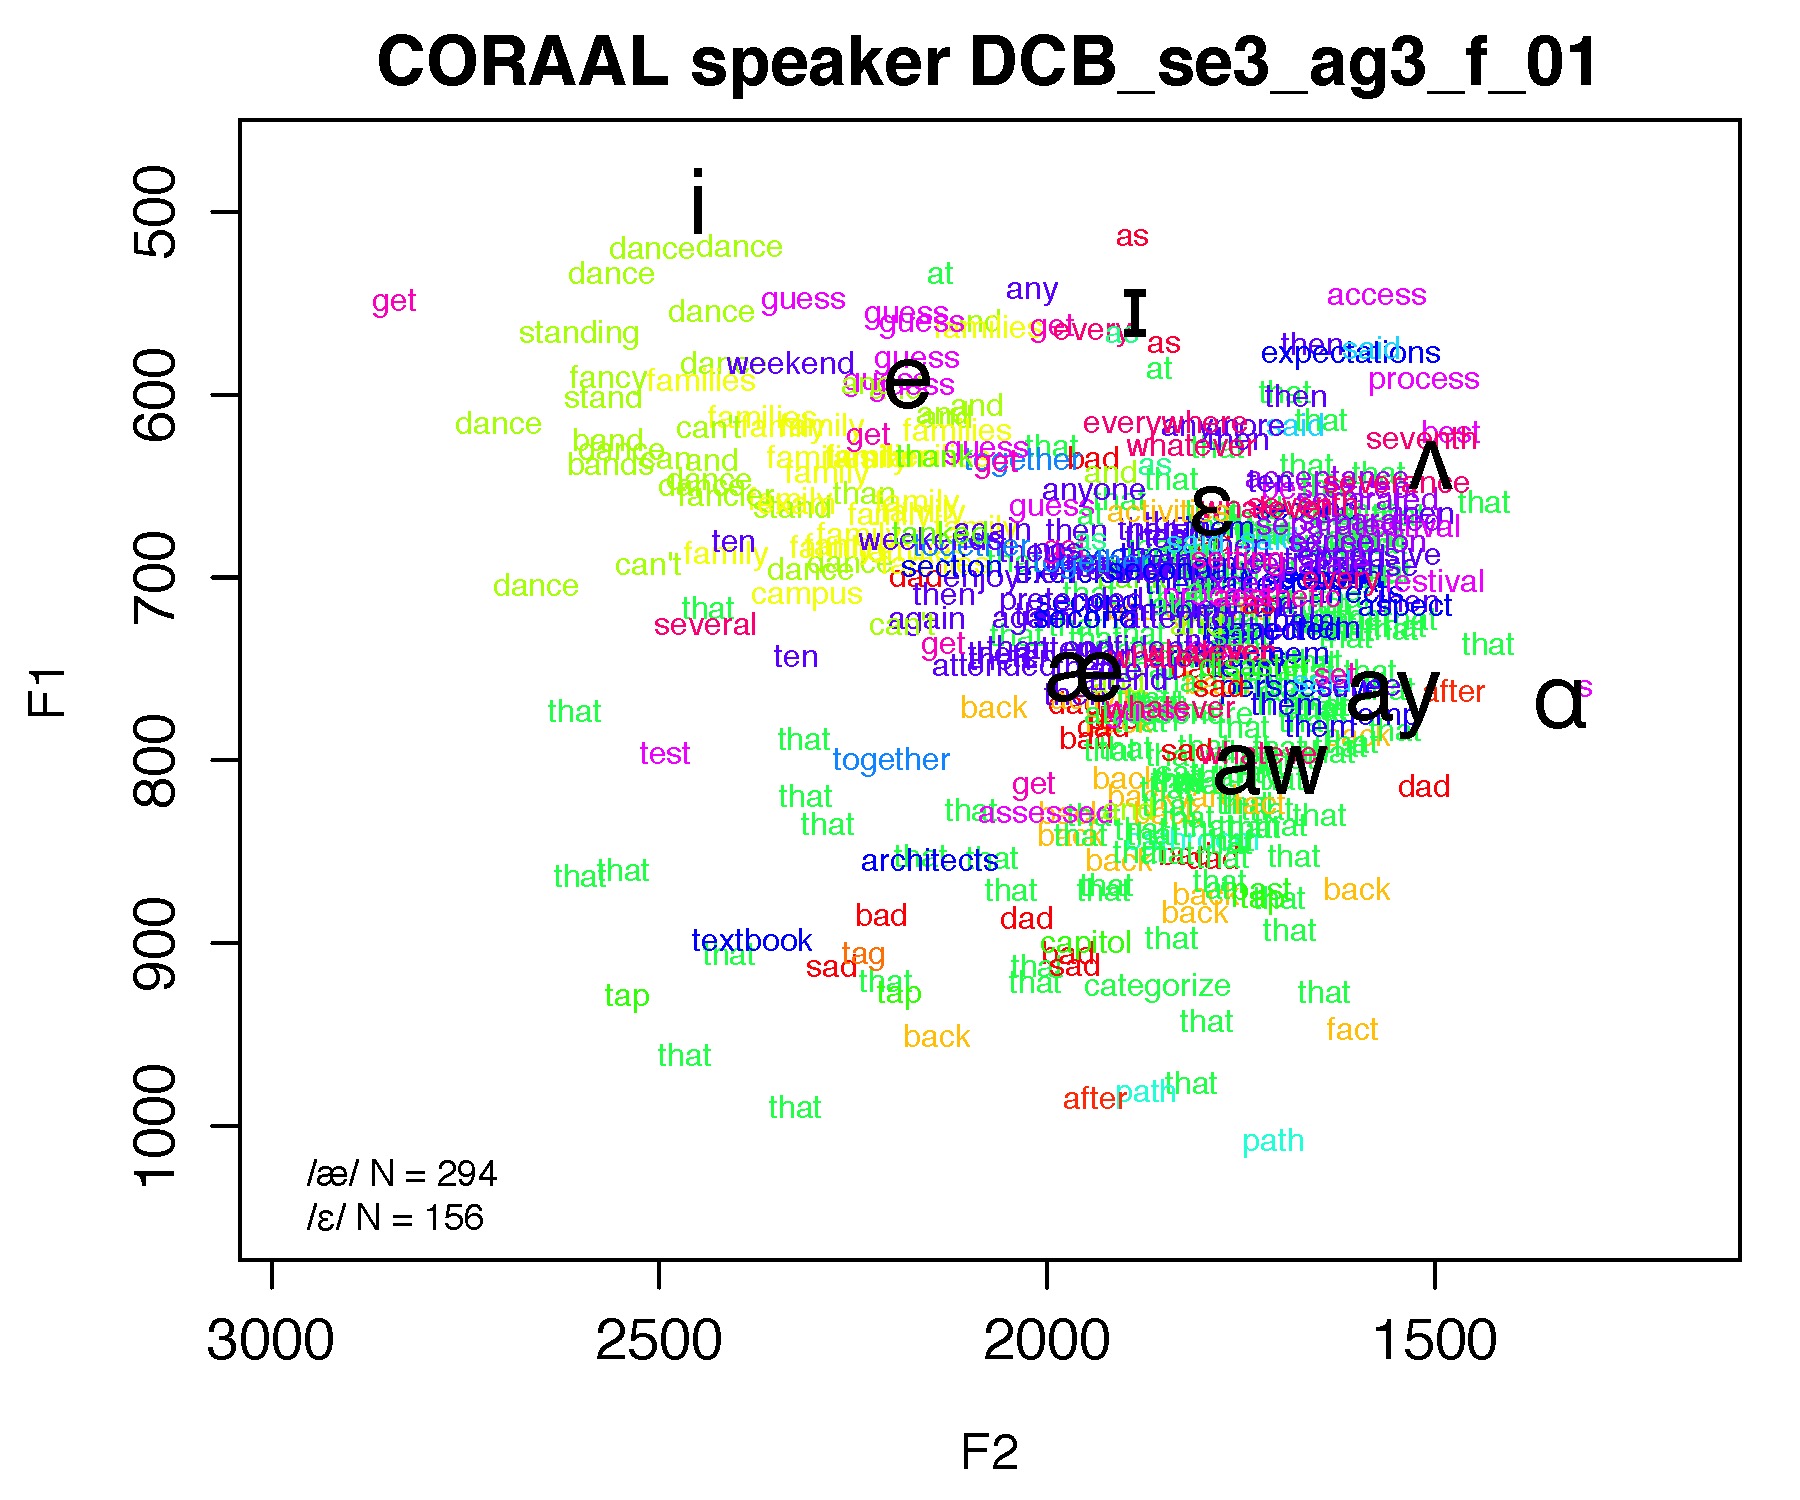
Data used for this figure: DCB_se3_ag3_f_01_1-out.txt
Script to reproduce this figure: Create_Fig6_1_Dec2020.R
Figure 8.2 Praat editor windows showing a sound file with orthographic transcription.
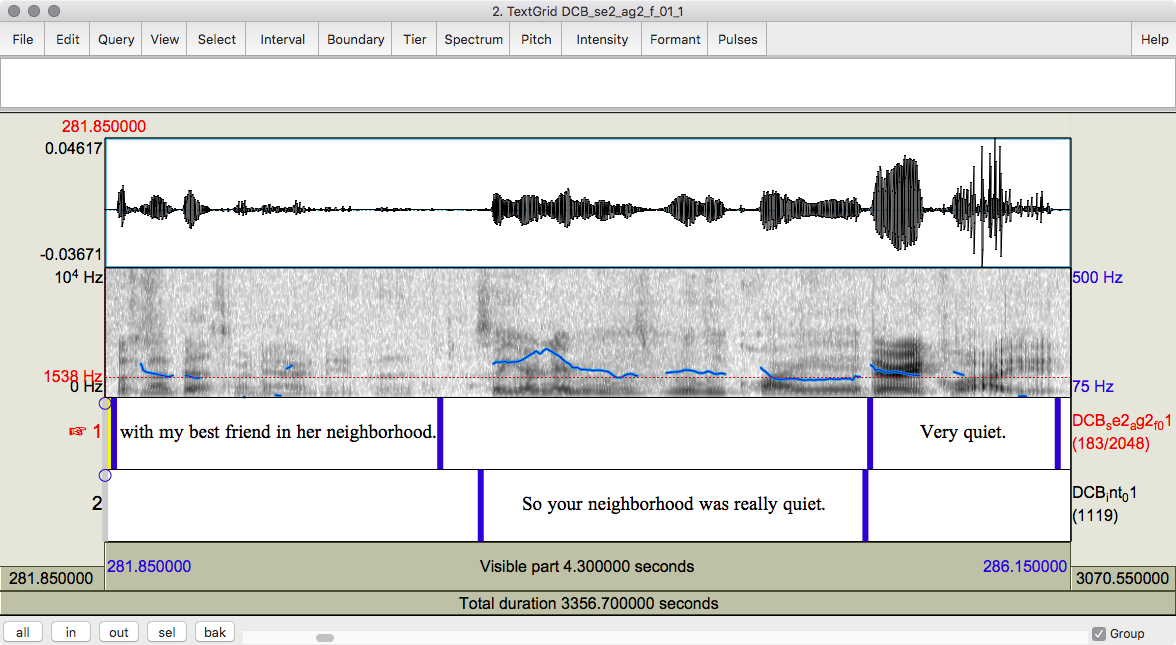
Figure 8.3 Praat editor window showing the same sound file with phonemic transcription after processing by forced alignment.
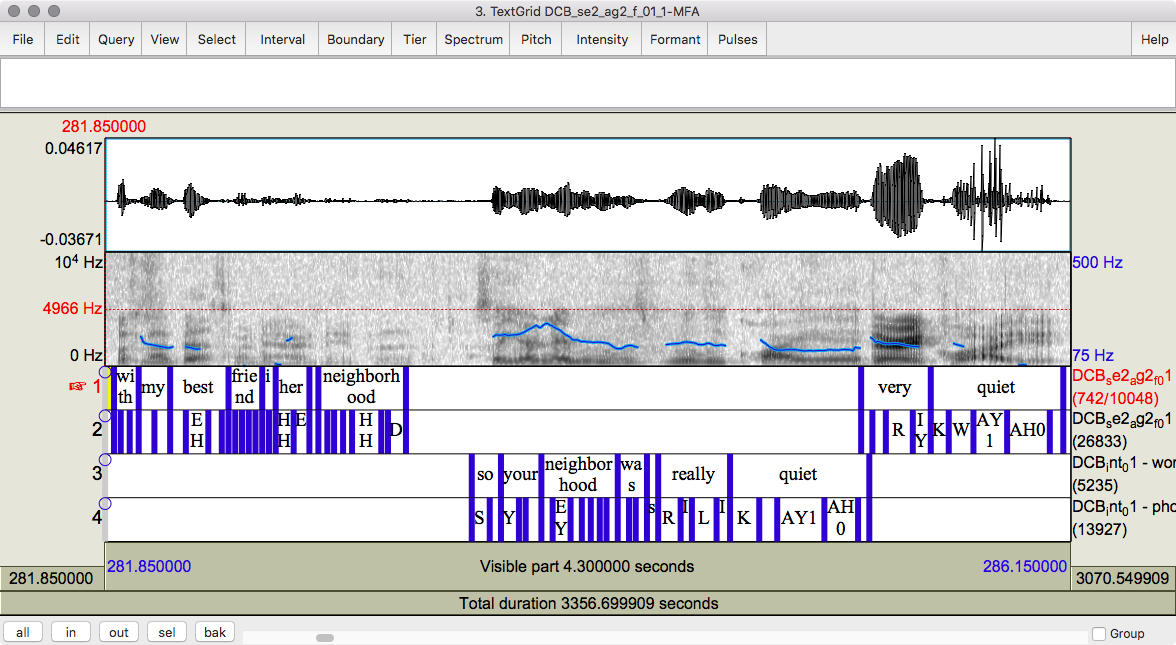
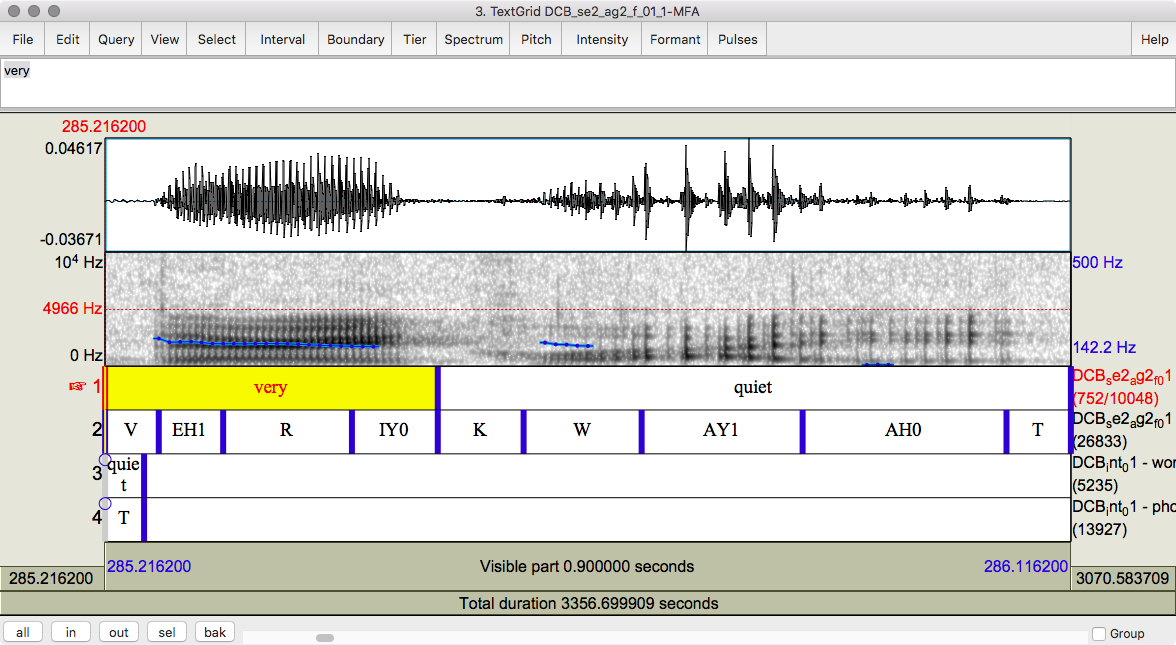
Figure 8.4 Close up on the utterance “very quiet,” showing the phone-level alignment more closely.
|