|
||||||||||||
| [ NORM v. 1.1 | original version ] | The Vowel Normalization and Plotting Suite | |||||||||||
|
| ||||||||||||
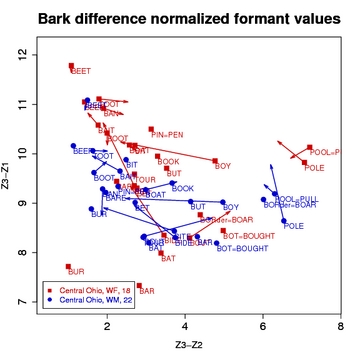
NORM's Vowel Normalization Methods (v. 1.1)Described here are each of the methods that are implemented in NORM. We highlight some of the major pros and cons of each method, as well as the specifics of its implementation within NORM. Note that these methods do not include all of the methods originally implemented in older versions of NORM. See the old NORM methods (v. 0.9) page for information on methods implemented earlier. Those methods are also still available through the old version (0.9) of NORM. Jump to a normalization method: Bark Difference MetricAbout: The Bark Difference Metric is a vowel-intrinsic method modified from the formula developed by Syrdal and Gopal (1986). Syrdal and Gopal proposed using two dimensions. Both involved computing differences between Bark-converted values (Z). To model advancement, they used either Z3-Z2 or Z2-Z1 (i.e., Bark-converted F3 minus Bark-converted F2 or Bark-converted F2 minus Bark-converted F1). To model height, they used Z1-Z0 (Bark-converted F1 minus Bark-converted F0). Z0 was used because, all other things being equal, F0 tends to be higher for high vowels than for low vowels, thus minimizing the distance between F0 and F1 for high vowels and maximizing it for low vowels. However, the problem is that all other things are seldom equal. Intonation, tone, and consonantal influences affect F0, as does creakiness. Those processes can be circumvented, but another factor, the effects of aging on F0, cannot, at least not speaker- and vowel-intrinsically. As a result, the Z3-Z1 is substituted here for Z1-Z0, though Z3-Z2 is retained. Implementation: NORM converts the formant values to bark using the formula (Traunmüller 1997):
Where Fi is the value for a given formant i. It then computes the differences Z3 - Z1, Z3 - Z2, and Z2 - Z1. Z3 - Z2 is used to plot the normalized front-back dimension and Z3 - Z1 is used to plot the normalized height dimension.
Advantages/Disadvantages: In general, the Bark Difference method does a reasonable job of filtering out physiological differences while retaining sociolinguistic differences. Because the resulting plots differ in shape from those produced by vowel-extrinsic methods, it is difficult to judge whether they do a better or worse job than the vowel-extrinsic methods. By far the biggest advantage of the Bark Difference method is that it does not require measurement of all vowels for all speakers to be included in a study. All the vowel-extrinsic methods work optimally when the entire vowel system is measured. This advantage can be crucial if a study is to include many speakers and the researcher lacks an army of research assistants to perform the acoustic measurements. Another advantage is that the Bark Difference method (or any other vowel-intrinsic method) is that it is immune to differences in the phonological inventories of dialects or languages. That is, it cannot be skewed by comparison of systems with different vowels, e.g., a language that has front rounded vowels and one that does not. In many communities in the southern United States, where whites show fronting of BOOT and BOAT while African Americans do not, such skewing could potentially occur with vowel-extrinsic methods. Another instantiation of this advantage has to do with the "bottom corner" of the vowel envelope. Some dialects have an [a] vowel that occupies this corner (see the accompanying early NCS and Tyrone vowel sets), while other dialects do not and instead have a low front vowel [æ] and a low back vowel located across from each other (see the accompanying central Ohio and Mexican American vowel sets). Some vowel-extrinsic methods tend to set the bottom of the normalized vowel space with the lowest vowel, whatever it is, which could skew the overall vowel space depending on whether the bottom corner is occupied, but a vowel-intrinsic method cannot do so. The most important disadvantage of the Bark Difference method is that it is heavily dependent on F3. For some recordings, F3 may be indistinct and hence difficult to measure--or, worse yet, faulty F3 readings may be obtained. Furthermore, rhoticized vowels, with their low F3, are not comparable to other vowels and have to be considered separately from the rest of the vowel inventory. If a speaker has unusual F3 characteristics, which might result from a physiological peculiarity in the speaker's mouth dimensions or nasality in the speaker's voice, that can also skew the Bark Difference method. Another seeming disadvantage is that the overall shape of the vowel often appears distorted. Some of the distortion is real; for example, high front unrounded vowels appear to be stretched higher than other high vowels because F3 is higher for them than for any other vowels. Other distortions may be more apparent than real, though. Many researchers like to see a "pretty" vowel plot, which is to say that they like a plot that resembles a plot of unnormalized F1/F2 values. However, this preference is something of a bias because most of us are accustomed to looking at F1/F2 plots. If, on the other hand, we ordinarily used Hertz-difference formant plots (this isn't totally improbable--recall, for instance, that Peter Ladefoged preferred to use F2-F1 to represent advancement), then Bark-difference plots might not look so weird. [ To Top ] Labov ANAE Method(s)
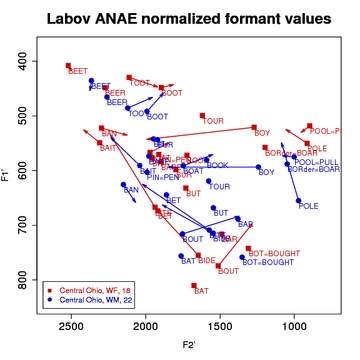
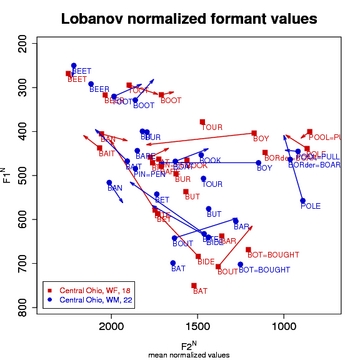
About: Labov's method - the normalization approach used by the phonological Atlas of North American English - is a modification of Nearey's. While it also uses a log-mean method to normalize the formant values, the primary difference is that it computes a single grand mean for all speakers included in the study (i.e. it's speaker-extrinsic, while Nearey is typically speaker-intrinsic). Also, unlike Nearey, it computes a scaling factor for each individual which is then used to modify each individual's vowel space rather than computing a set of non-Hertz-like values. In other words, since it is speaker-extrinsic, it is able to scale the original Hertz values as a part of its normalization process. Implementation: NORM's implementation of the Labov method follows the formulas laid out by Labov, Ash, and Boberg (2006: 39-40). A logarithmic grand mean, G, is calculated from the geometric mean of the natural log of the F1 and F2 values of all vowels for all speakers. A logarithmic mean value, S, is then calculated for each speaker by taking the natural log of the F1 and F2 values for all of that speaker's vowels. The anti-log of the difference, G - S, is taken for F, the scaling factor for that speaker. Each individual's formant values are then multiplied by the scaling factor F to obtain her or his normalized values. Multiple Methods: NORM currently offers three versions of the Labov method. The first method, labeled speaker extrinsic, calculates the grand mean as described immediately above, using the speakers supplied in your uploaded spreadsheet. The using Telsur G value methods actually do not calculate the grand mean from your data. Instead they use the constant G = 6.896874 as the grand mean. This is the value Labov et al. (2006: 40) provide as their group mean for 345 American English speakers. In practice, the difference between the two Labov methods should simply affect the scaling - the specific Hertz values - of your output. Using the Labov ANAE method with the Telsur G value for American English data will presumably make your findings most comparable to the Atlas of North American English. Note there has been a slight change in the implementation of this method between NORM version 0.9 and NORM version 1.0, resulting in our providing a third version - the algorithm implemented in older versions of NORM. We believe that the new version is more accurate to the formula laid out by Labov et al. There are only differences in the method when using the Telsur G value. Our tests indicate that the differences between the two methods are very small (~13 Hz for F1, ~40 Hz for F2; in none of our tests did the differences between the two methods achieve statistical significance). Nonetheless, we keep the old version available here for compatability. Advantages/Disadvantages: The Labov method has the same advantages and disadvantages as the Nearey formula. In addition, however, the practice of calculating a single grand mean for all speakers can introduce distortions of some normalized values. We observed quite noticeable distortions, especially for the vowel height scale, for certain comparisons of speakers in our sample datasets. As Labov, Ash, and Boberg (2006: 40) point out, G, the grand mean for all speakers, continues to change as the number of subjects increases. They found that above 345 subject the G value ceases to change significantly. This likely indicates that this method (and perhaps speaker-extrinsic methods in general) are best only when a study has an exceptionally high subject count. [ To Top ] Lobanov Method(s)About: Lobanov's method was one of the earlier vowel-extrinsic formulas to appear, but it remains among the best. Implementation: Following Nearey (1977) and Adank et al. (2004), NORM uses the formula (see the General Note below):
Where Fn[V]N is the normalized value for Fn[V] (i.e., for formant n of vowel V). MEANn is the mean value for formant n for the speaker in question and Sn is the standard deviation for the speaker's formant n.
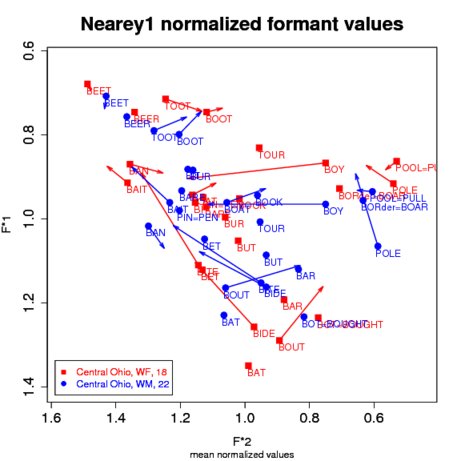
Advantages/Disadvantages: The Lobanov method does an excellent job of factoring out physiologically-caused differences in formant values while retaining sociolinguistic differences. Moreover, Adank et al. (2004) found that, overall, it performed the best of all the techniques they tested in a discriminant analysis of normalized Dutch vowels (though only marginally better than Nearey's formula), was tied with Nearey in reducing physiological variation, and fared slightly worse than Nearey at preserving sociolinguistic variation. Disner (1980), however, who compared data from several languages, found that Lobanov was somewhat poorer than Nearey at reducing scatter in vowel measurements. She also noted that all of the vowel-extrinsic methods performed poorly at retaining "linguistic validity," that is, at preserving subtle language-specific differences in analogous vowels. Lobanov makes attractive and easily readable plots that resemble F1/F2 formant plots. The results, however, are not in Hertz-like values so scaling is necessary to convert the normalized values to something more familiar (see the About Scaling section). Lobanov has two main disadvantages. First, like other vowel-extrinsic formulas, it works optimally when all the vowels of speakers' vowel systems are included. When some vowels are excluded, vowel-extrinsic methods will yield skewed normalized values. This issue, of course, is a problem for researchers with tight time or budgetary constraints. The other disadvantage, also shared with other vowel-extrinsic methods, is that it may be impaired when different dialects or languages that show different vowel systems are compared. For example, in the accompanying central Ohio dataset, see Figure 3, the BOOT and BOAT vowels are strongly fronted, which causes the whole vowel system to be weighted toward front vowels. When this dialect is normalized together with another dialect that lacks this fronting, the normalized values for the central Ohioans are shifted slightly to the right (i.e., all the vowels are represented as slightly more backed than they should be). General Note on Lobanov: Lobanov's (1971) publication, which introduced his method, actually reported using the rms (or root mean square) deviation and not the standard deviation for the denominator of the normalization formula. While the overall result of the formula is the same (since we're interested in the relative position of the vowels and the overall vowel space and not the actual numbers derived from the formula), it is unclear to the authors why Nearey (1977), Adank et al. (2004), and others report Lobanov's formula as using the standard deviation. Of course, for our implementation in NORM we've followed the preponderance of recent practice and also used the standard deviation. [ To Top ] Nearey Method(s)Important Note: Until Oct. 13th 2008, NORM only implemented the Nearey2 formula (these methods were until then labeled simply as "Nearey"). NORM now also implements the Nearey1 formula, which has generally been found to be better (cf. Adank et al. 2004). About: NORM implements two versions of the method that Terrance Nearey developed in his 1977 dissertation. The Nearey methods are vowel-extrinsic and in general rather similar to the Lobanov formula, though their formulae differ in that they normalize using log mean values. NORM follows Adank et al. (2004) in naming the major branches of the Nearey method Nearey1 and Nearey2. Implementation: To normalize with the Nearey1 method, NORM uses the formula:
Where F*n[V] is the normalized value for Fn[V], formant n of vowel V, and mean(log(Fn)) is the log-mean of all Fns for the speaker in question. To normalize with the Nearey2 method, NORM uses the formula:
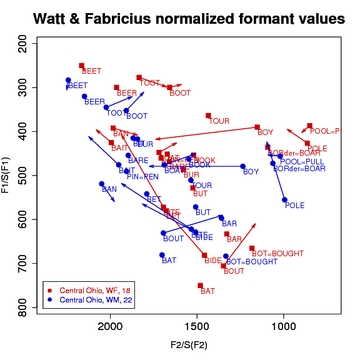
Where F*n[V] is the normalized value for Fn[V], formant n of vowel V, and MEANlog is the log-mean of all F1s and F2s (and F3s, if the Include F3 in Processing option is selected) for the speaker in question. Put plainly, the difference between Nearey1 and Nearey2 is that Nearey1 is formant-intrinsic and Nearey2 is formant-extrinsic. Important: When Include F3 in Processing is selected from the NORM form, the F3 values are included in the generation of the grand mean value for Nearey2 - this gives different numeric results for F1 and F2 than when running Nearey2 without F3s. For this reason, you cannot compare speakers normalized with F3 values with those normalized without F3 values. Advantages/Disadvantages: Much of what was said about the Lobanov formula also applies to Nearey. As noted above, Adank et al. (2004) found that it performed well in a discriminant analysis of normalized Dutch vowels in reducing physiological variation, and no worse than the other methods compared at preserving sociolinguistic variation. Disner (1980) found that it reduced scatter the best of all the methods she compared. Like Lobanov, the Nearey formula yields attractive and easily readable plots of normalized values, but needs to be scaled to Hertz-like values (see About Scaling). Nearey suffers from the same disadvantages as Lobanov. It performs best when the entire vowel system is included, which can be impractical for studies of many speakers. Use of fewer vowels will skew the normalized values. Furthermore, its effectiveness is slightly compromised when it is used to compare lects with different phonological inventories because, as noted above for Lobanov, some skewing of normalized values will result. [ To Top ] Watt & Fabricius MethodAbout: The Watt & Fabricius method is vowel-extrinsic, but unlike Lobanov's, Nearey's, and Labov's methods, the centroid or grand mean value that it uses to calculate normalized values is based on points that represent the corners of the vowel envelope: one for the high front corner, one for the high back corner, and one for the bottom corner. In Watt & Fabricius's original formulation, which was designed for the RP dialect of English, the mean F1 and F2 of the BEET vowel were used as the minimum F1 and maximum F2 values; the minimum F1 value of BEET was also used as the minimum F2 value. The mean F1 and F2 of BAT (which Watt and Fabricius label as TRAP) comprised the point for the bottom corner of the vowel envelope. Watt and Fabricius (2002) provide a clear step-by-step example of their process. Fabricius, Watt, and Johnson (2009) also provide a thorough discussion of the method. Implementation: NORM modifies Watt & Fabricius's original formulation in the following ways. First, NORM equates the minimum F1 value with whichever mean F1 happened to be lowest, whether or not it was the BEET vowel. Second, it does the same for the maximum F2 value. Third, because the BAT vowel is not the one with the highest F1 value in some American dialects (and in other languages), NORM assigns whichever vowel has the highest F1 to be the point representing the bottom corner of the vowel envelope. Following Watt & Fabricius, NORM uses the minimum F1 value for both the F1 and F2 for, SCHOOL, the back-top corner of the vowel envelope. In other words, the S transforms, as Watt & Fabricius, call them are calculated thusly:
Where BEET and BAT stand for the acoustically measured top-front and bottom-middle of the vowel envelope and SCHOOL stands for the top-back corner, with SCHOOLF1 and SCHOOLF2 = BEETF1 (as described above). Normalized values are then computed by dividing each vowel's mean F1 and F2 by the appropriate S transform. Finally, note that Watt & Fabricius bases these corner points on mean values - i.e., means of un-normalized formant values are computed and then used to normalize the vowels.
NORM implements a second version of the Watt & Fabricius method (Watt & Fabricius, modified), following Fabricius, Watt, and Johnson (2009). The Watt & Fabricius modified version is identical to the main method, but computes the F2 value of the bottom corner of the vowel envelope (BATF2) as the midpoint between BEETF2 and SCHOOLF2. This idealization of the bottom of the vowel envelope helps counteract the effect of actual low vowels which are not centered in speakers' vowel spaces. Advantages/Disadvantages: All the advantages and disadvantages described above for the Lobanov and Nearey techniques apply to Watt & Fabricius. In addition, however, this method also appears to show some distortion at the bottom of the vowel envelope. This problem appears to be due to the fact that some lects show a vowel at the very bottom point of the possible vowel space, while other lects instead show two parallel low vowels somewhat higher in the vowel space. This distortion at the bottom of the vowel envelope is lessened by the Watt & Fabricius modified method. | ||||||||||||
| NORM v. 1.1 Last Mod: 2/14/2025 | © Erik R. Thomas & Tyler Kendall 2007-2015 erthomas [at] ncsu.edu & tsk [at] uoregon.edu |